A simple question people rarely ask
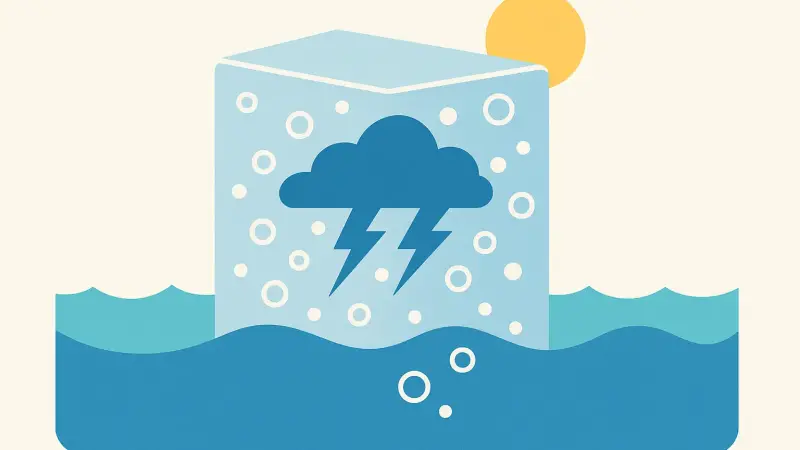
When you see a piece of sea ice, it’s easy to assume it’s just frozen ocean water. But why does it sometimes look cloudy, with tiny white specks or threads inside? In places like the Weddell Sea off Antarctica and the Beaufort Sea in the Arctic, that “messy” look often comes from air getting trapped as the ice forms. The key is that seawater doesn’t freeze all at once. It grows as a porous crystal network. As the crystals lock together, pockets of air and seawater can get sealed in. Those pockets can end up preserving short-lived moments, including stormy periods when the ocean surface is violently mixed.
How sea ice actually freezes
Freshwater ice tends to freeze into a clearer solid. Seawater behaves differently because salt lowers the freezing point and forces the growing ice to reject most of the salt. Early sea ice forms a spongy structure made of interlocking ice platelets. Between them is brine: very salty liquid held in narrow channels and pockets. This is why first-year sea ice can be surprisingly permeable and why it changes quickly with temperature. When it is cold, brine channels constrict and can pinch off, turning connected pathways into isolated inclusions.
One overlooked detail is that “air bubbles” in sea ice aren’t always pure air at the moment they form. Many begin as mixed pockets that include brine, dissolved gases, and sometimes tiny particles. As the ice cools and brine drains or freezes further, those pockets can separate into clearer gas bubbles and concentrated brine inclusions. That step matters, because the bubble population you measure later can reflect several stages of the ice’s life, not just the instant it first froze.
Where the bubbles come from
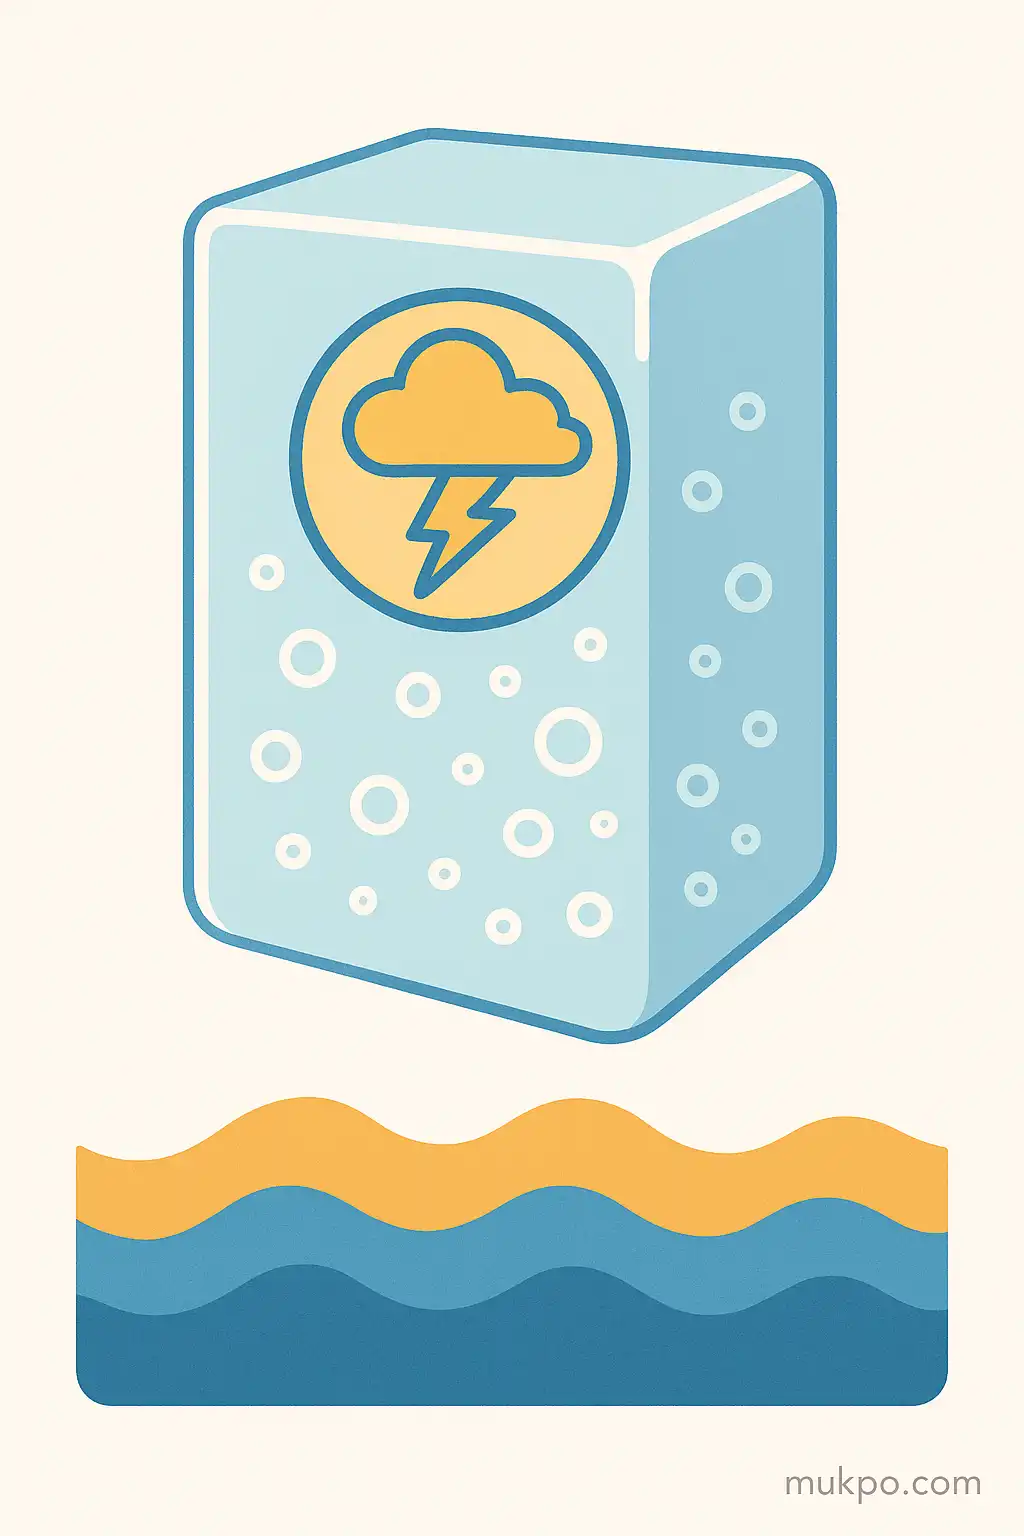
Some gas is already dissolved in seawater. If the water becomes supersaturated, gases can come out of solution and form bubbles, especially when conditions shift quickly. Another source is simple entrainment: wind and waves break the surface, inject foam and spray, and push air downward. During calm conditions, that air exchange is limited. During storms, it becomes aggressive. Strong winds and wave breaking create a churned surface layer full of small bubbles, and newly forming ice can trap part of that bubbly mixture.
Storms also change the timing. New ice forms fastest during cold snaps, often right after a storm has opened leads (stretches of open water) in an existing ice cover. That open water loses heat rapidly to the atmosphere. Frazil ice—tiny disk-like crystals—forms in the turbulent water and accumulates into grease ice and then a more solid sheet. If that water is still full of entrained air from the storm, the freeze-up phase can lock in an unusually high number of small bubbles compared with ice that formed under quieter skies.
How a storm’s “signature” can end up in the ice
A storm doesn’t label a bubble with a date. The signal is indirect. One way is through bubble size and density. More violent mixing tends to produce lots of small bubbles rather than fewer large ones, and the ice can preserve that distribution if the freezing front advances quickly enough. Another route is chemistry. Storm-driven mixing can pull up deeper water with different temperature, salinity, and dissolved gas levels, which can shift how much gas is available to be trapped when the ice consolidates.
There are limits, and they vary by location and season. Sea ice is not automatically an archive the way glacier ice is. It warms, cools, floods, drains brine, and can deform. If brine channels reopen during warmer periods, gases can move and bubbles can change. That makes the cleanest “storm capture” more likely in rapidly formed, cold, young ice. It also makes it harder to interpret older sea ice without knowing its temperature history and how connected the brine network was over time.
What scientists measure when they look for that record
Researchers extract ice cores and examine them in cold labs so the internal structure doesn’t melt and rearrange. They can image bubbles and brine inclusions with thin sections under polarized light, micro-CT scans, or other microscopy methods that resolve shapes and connectivity. They can also analyze gases released when ice is carefully melted or crushed under controlled conditions, looking at concentrations and sometimes isotopic ratios. The tricky part is separating what reflects formation conditions from what reflects later changes inside the ice.
A concrete situational example is a winter lead that opens during a strong wind event, then refreezes over the next day in subfreezing air. That patch of newly formed ice may preserve a higher bubble density right near the top or in specific layers tied to the frazil-to-sheet transition. Another easily missed detail is that snow on top can insulate the ice, slowing cooling and keeping brine channels more open, which can blur the bubble record even if the storm injection was real.
Why it’s hard, and why people still try
Why it’s hard, and why people still try
Sea ice sits at the interface of air and ocean, so it is exposed to the very processes people want to reconstruct. That’s the appeal and the headache. Winds, waves, and abrupt freeze-up can imprint a bubble field that looks storm-related. Then the ice continues to evolve: brine drains, cracks form, pressure ridges build, meltwater percolates in spring. Each step can overprint what came before. So “ancient storms” in sea ice usually means earlier within a season or within the lifetime of a drifting floe, not centuries back, and how far back you can read depends on how stable the ice stayed.
Related reads
- A vending machine that always ejects a single antique spoon
- How your nose adapts so you can’t smell your own perfume
- The apartment where each mirror shows a different hallway
- Why you walk into a room and forget your purpose
- The elevator rule: why tiny strangers’ talk feels so awkward
- When it literally rained frogs and fish